Agricultural Organization Dashboard
Turn every member's scan into outbreak alerts, bulk-order demand, and loan-ready farm plans.
Overview
A web dashboard for agricultural organization managers and input partners that turns anonymized, consented scan activity into barangay-level disease alerts, input demand forecasts, and harvest risk indicators, the intelligence layer on top of the farmer app. An early working prototype exists; the figures it currently displays are sample data for layout demonstration, and we would rather say so than imply otherwise. Our first deployment, with the NAGPAKABANA Multipurpose Cooperative in Camiguin, is confirmed.
Who it’s for: Agricultural organizations and their managers.
Planned features
None of this is shipped. It is what the dashboard is being built to do once member scans start syncing.
Outbreak Intelligence
PlannedDisease heatmaps and active alerts, so a cluster like three farms in Barangay X reporting bacterial wilt surfaces as a warning zone instead of four separate problems nobody connects.
Input Demand Engine
PlannedMember input needs aggregated into one season view, feeding a bulk-order builder so the organization buys once at volume rather than over-ordering on guesswork.
Harvest Forecasting
PlannedPredicted volumes, timelines, and surplus or shortage alerts, early enough for the organization to move on them while there is still something to decide.
Farm Plan Generator
PlannedFarm plans built from a member's own scan history, formatted to the ATI and ACPC requirements that lenders ask for.
A look inside the prototype
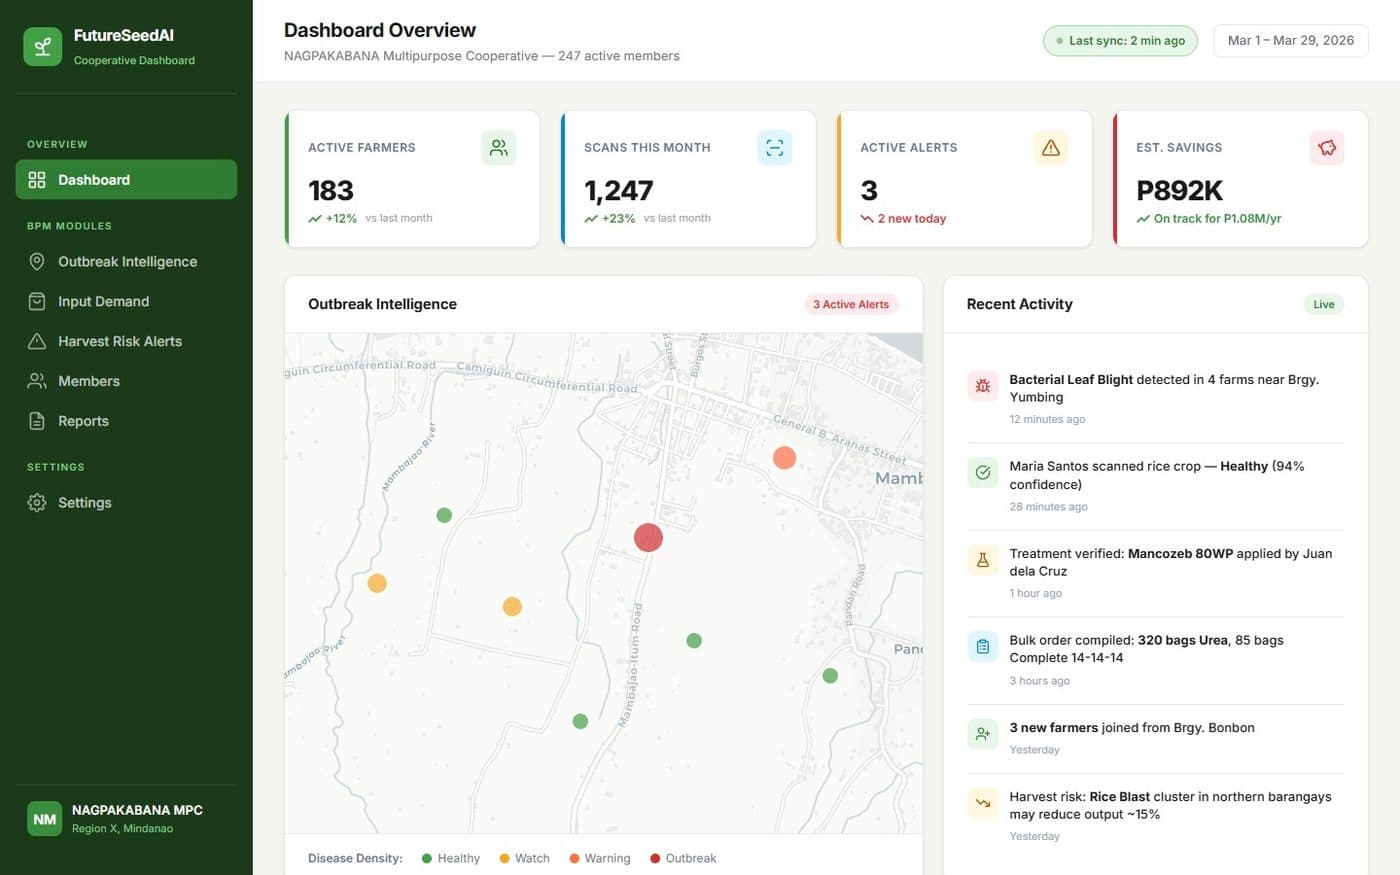
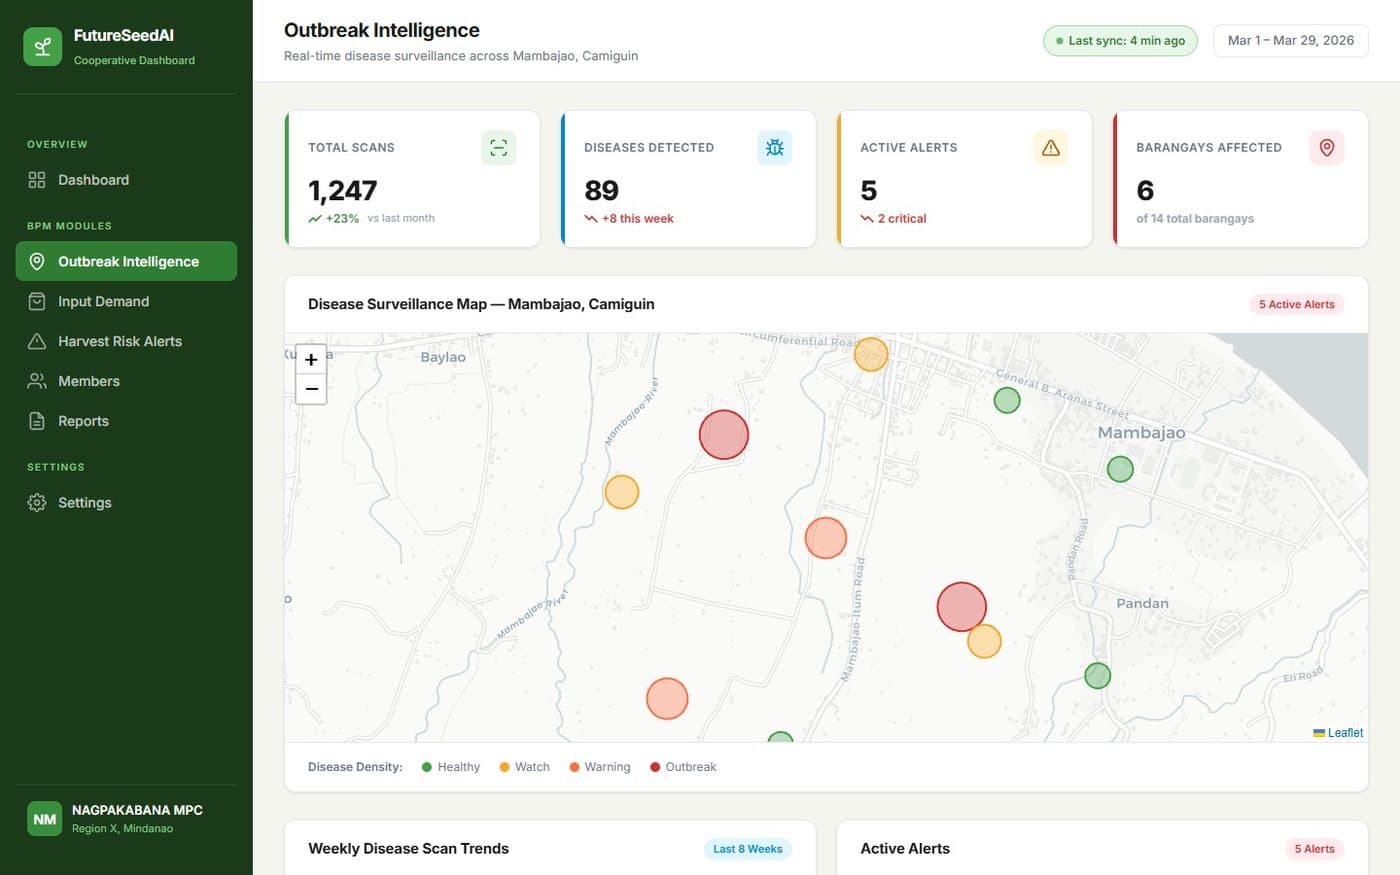
Four modules, one shared source: every member scan that syncs. These are design mockups of the dashboard we are building, shown with sample data.
Prototype, figures are sample data
01Module
One screen for the organization
Active members, scans this month, live alerts, and estimated savings, compiled from member scans as they sync. A manager opens one page and knows where the organization stands today.
02Module
Outbreak intelligence
Anonymized scans plot onto a barangay-level map, so a cluster of Bacterial Leaf Blight shows up as a warning zone with recommended actions before it spreads farm to farm.
03Module
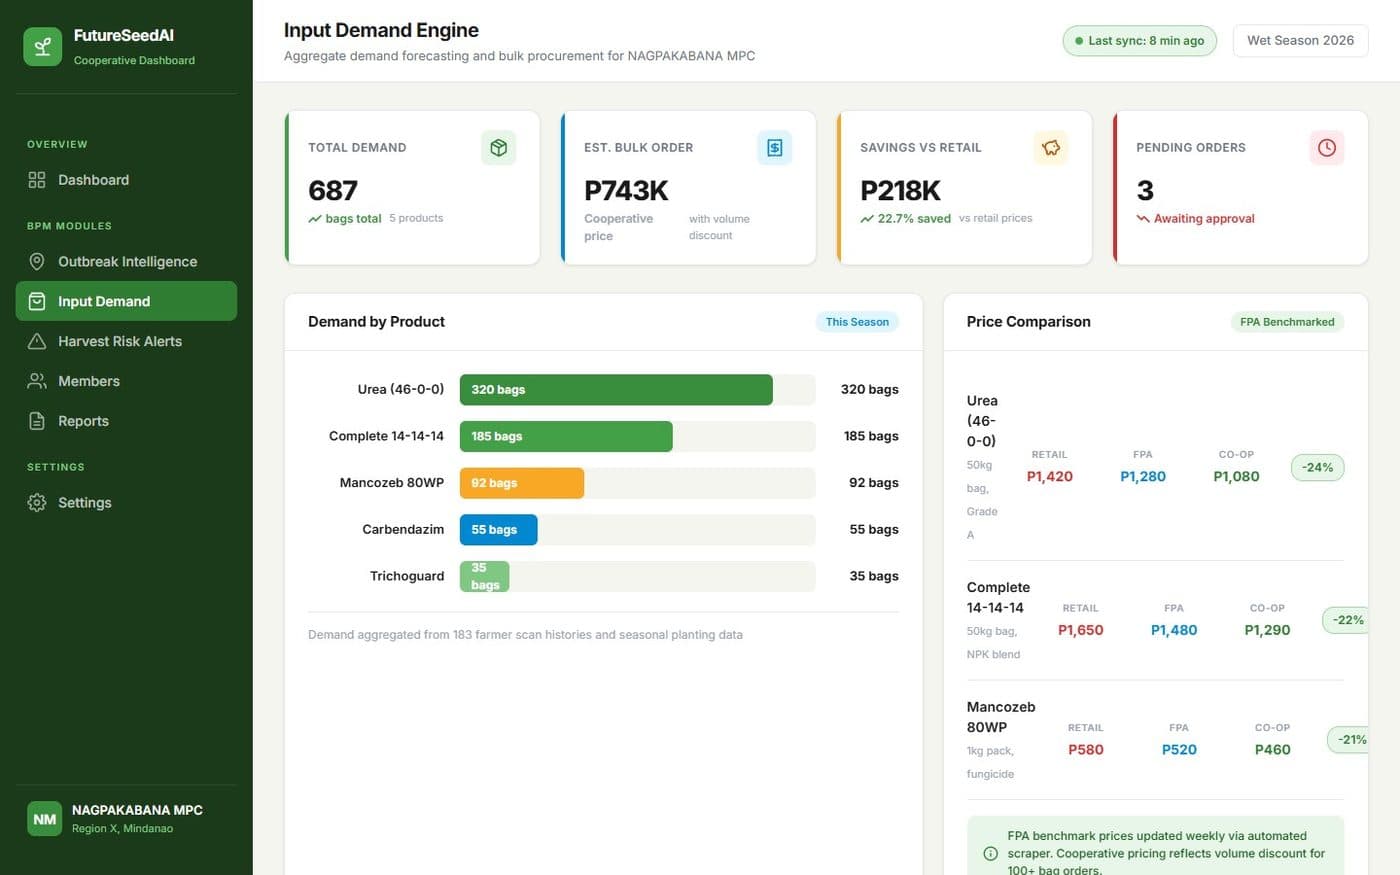
Input demand
Member needs aggregate into one season view, feeding a bulk-order builder so the organization buys the right inputs once, at volume, instead of over-ordering on guesswork.
04Module
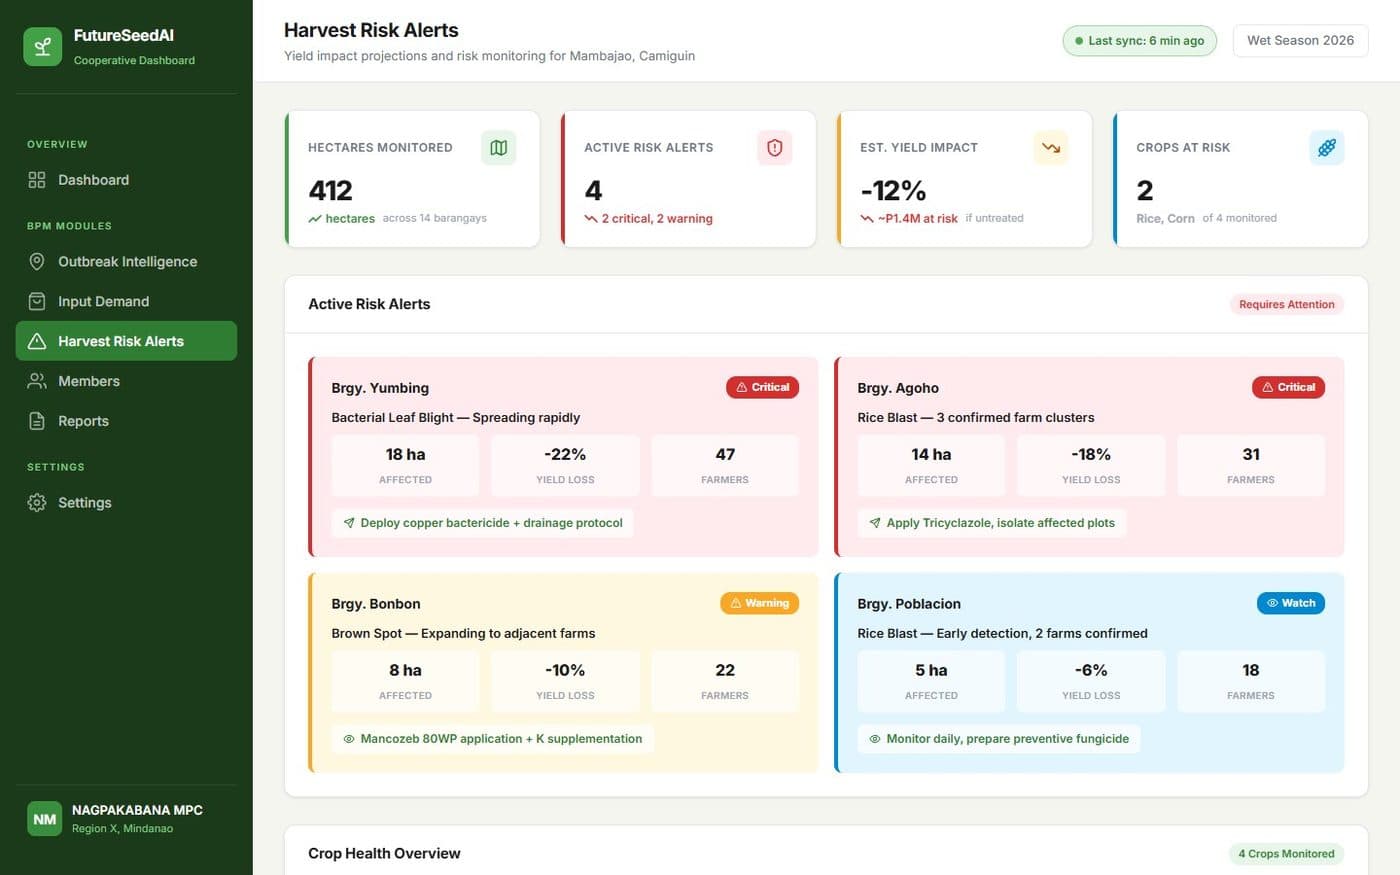
Harvest risk
Disease clusters and scan history roll up into forecast risk per crop and area, flagging where output is threatened early enough for the organization to respond.
Prototype, figures are sample data
Want it for your agricultural organization?
Early conversations shape what we build. Tell us what your organization needs.